
Warehouse Manager
Capture images from phone or camera, run the computer vision count, validate exceptions and submit the report for final audit.
Enter authorization credentials to access the Brown Strauss Steel stack counting environment.
This dual-role application shows the complete proposed workflow: a Warehouse Manager captures structural steel images and submits an AI-assisted count, then an Audit Manager independently reviews the evidence, validates the quantity and provides the final decision.
The on-screen guide will take you from the use case story to the live count, review, dashboard, architecture and pilot roadmap.
The same report moves through two secured workspaces with a complete audit trail.
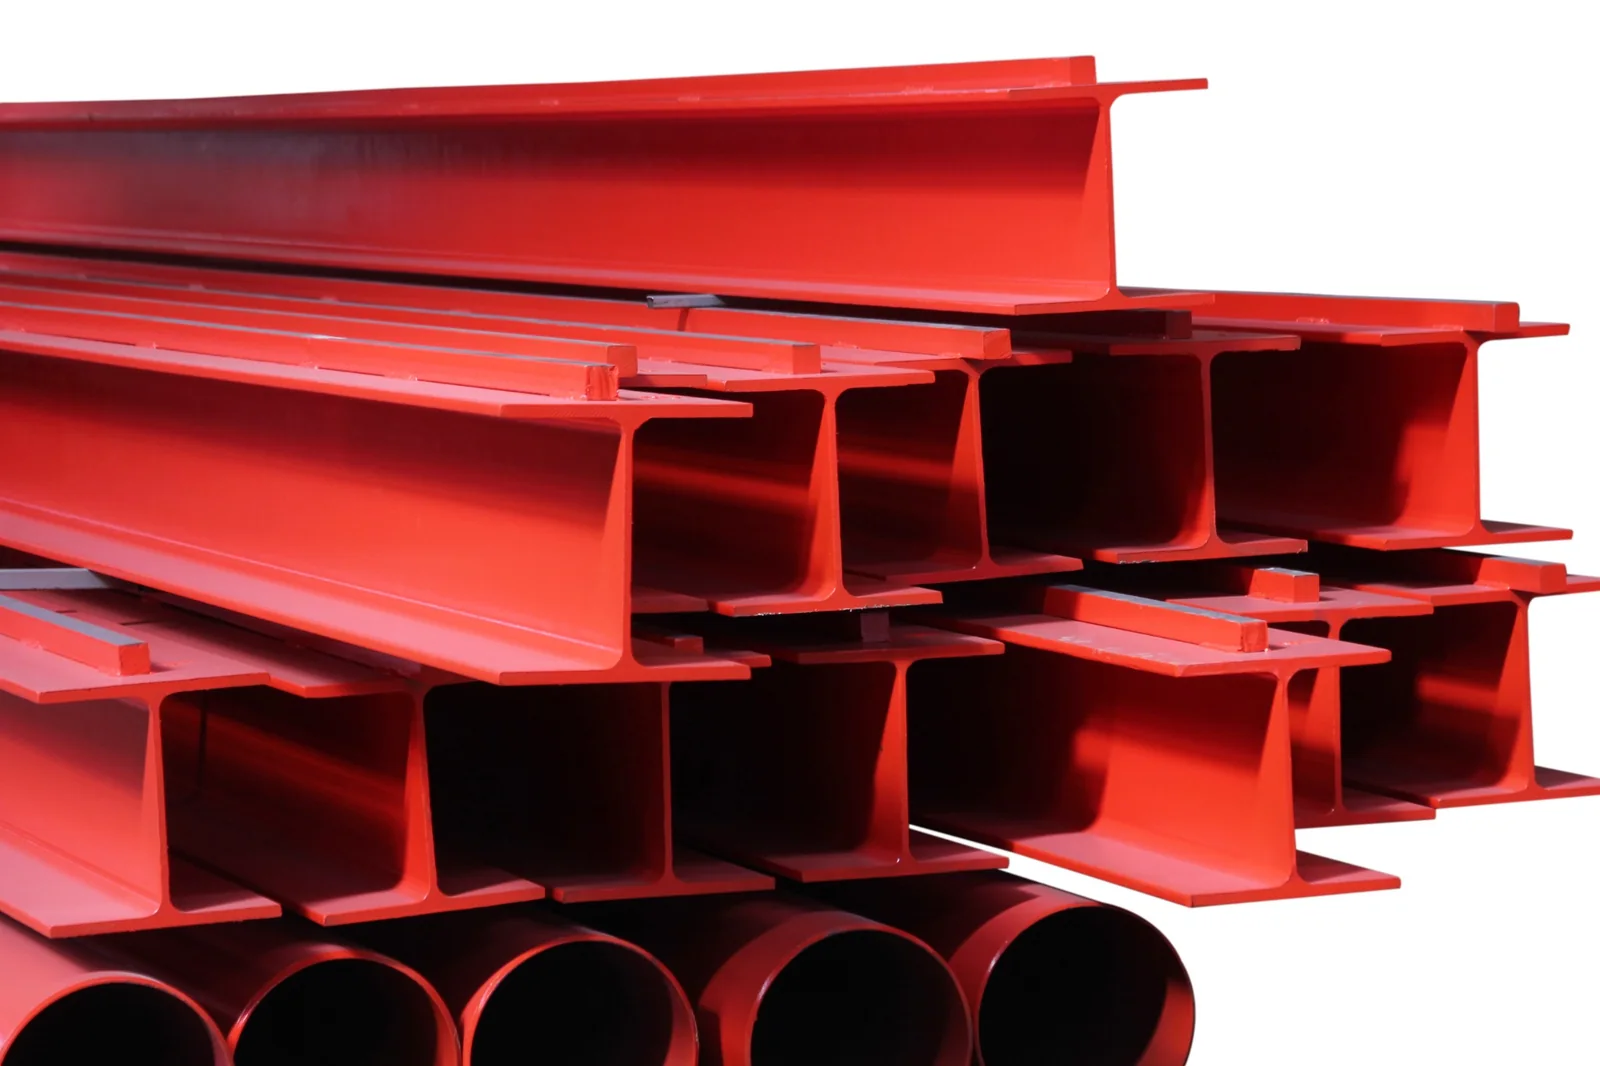
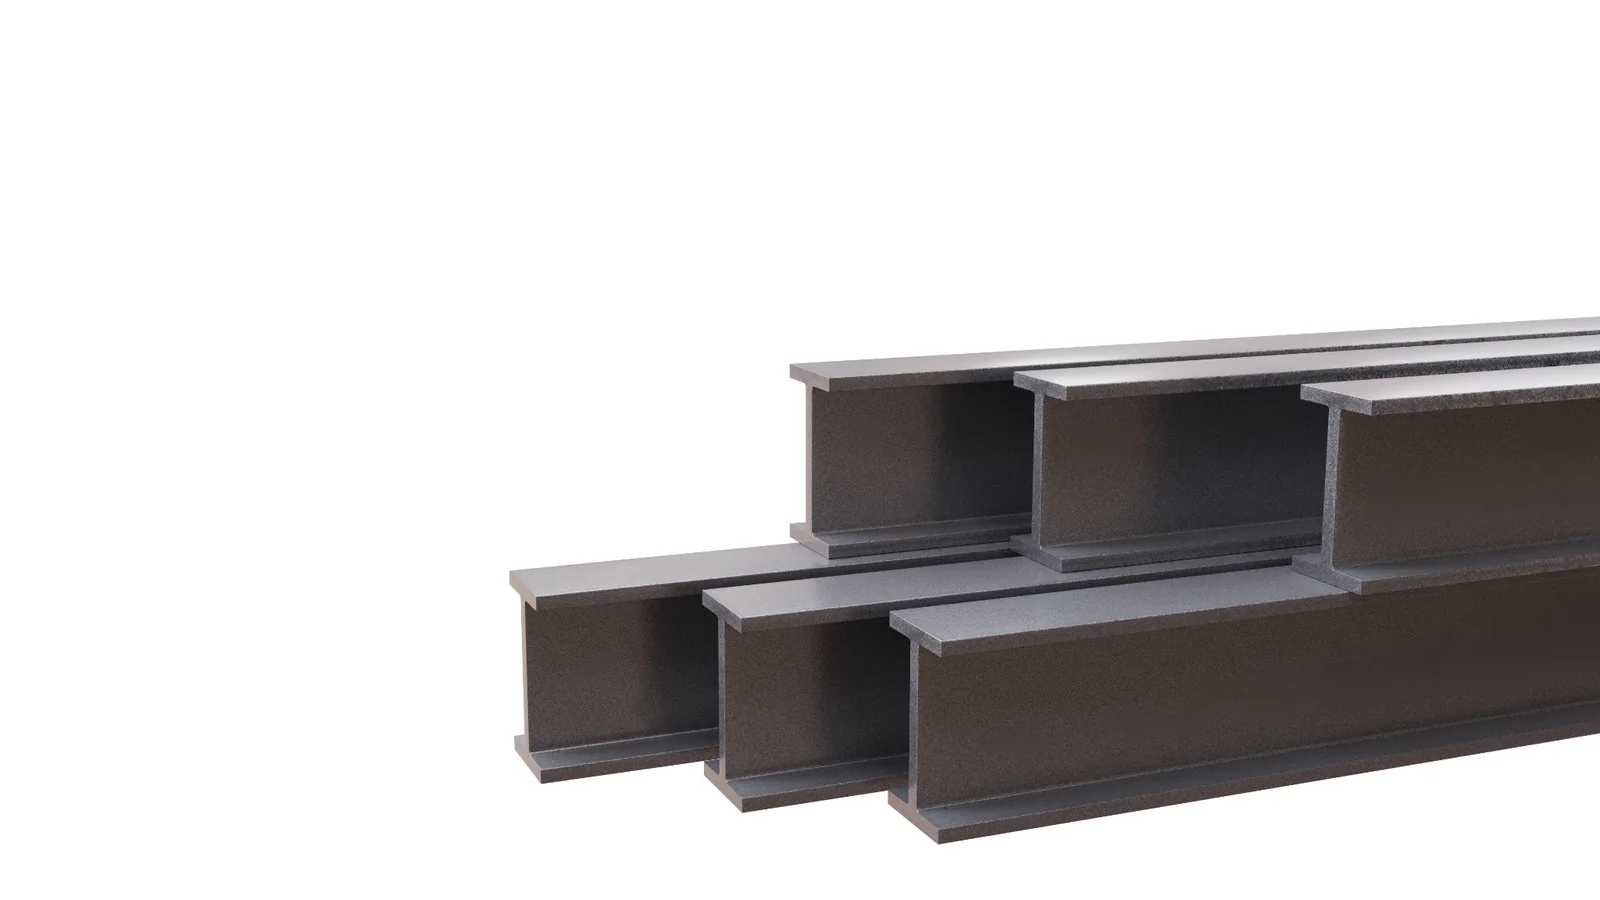
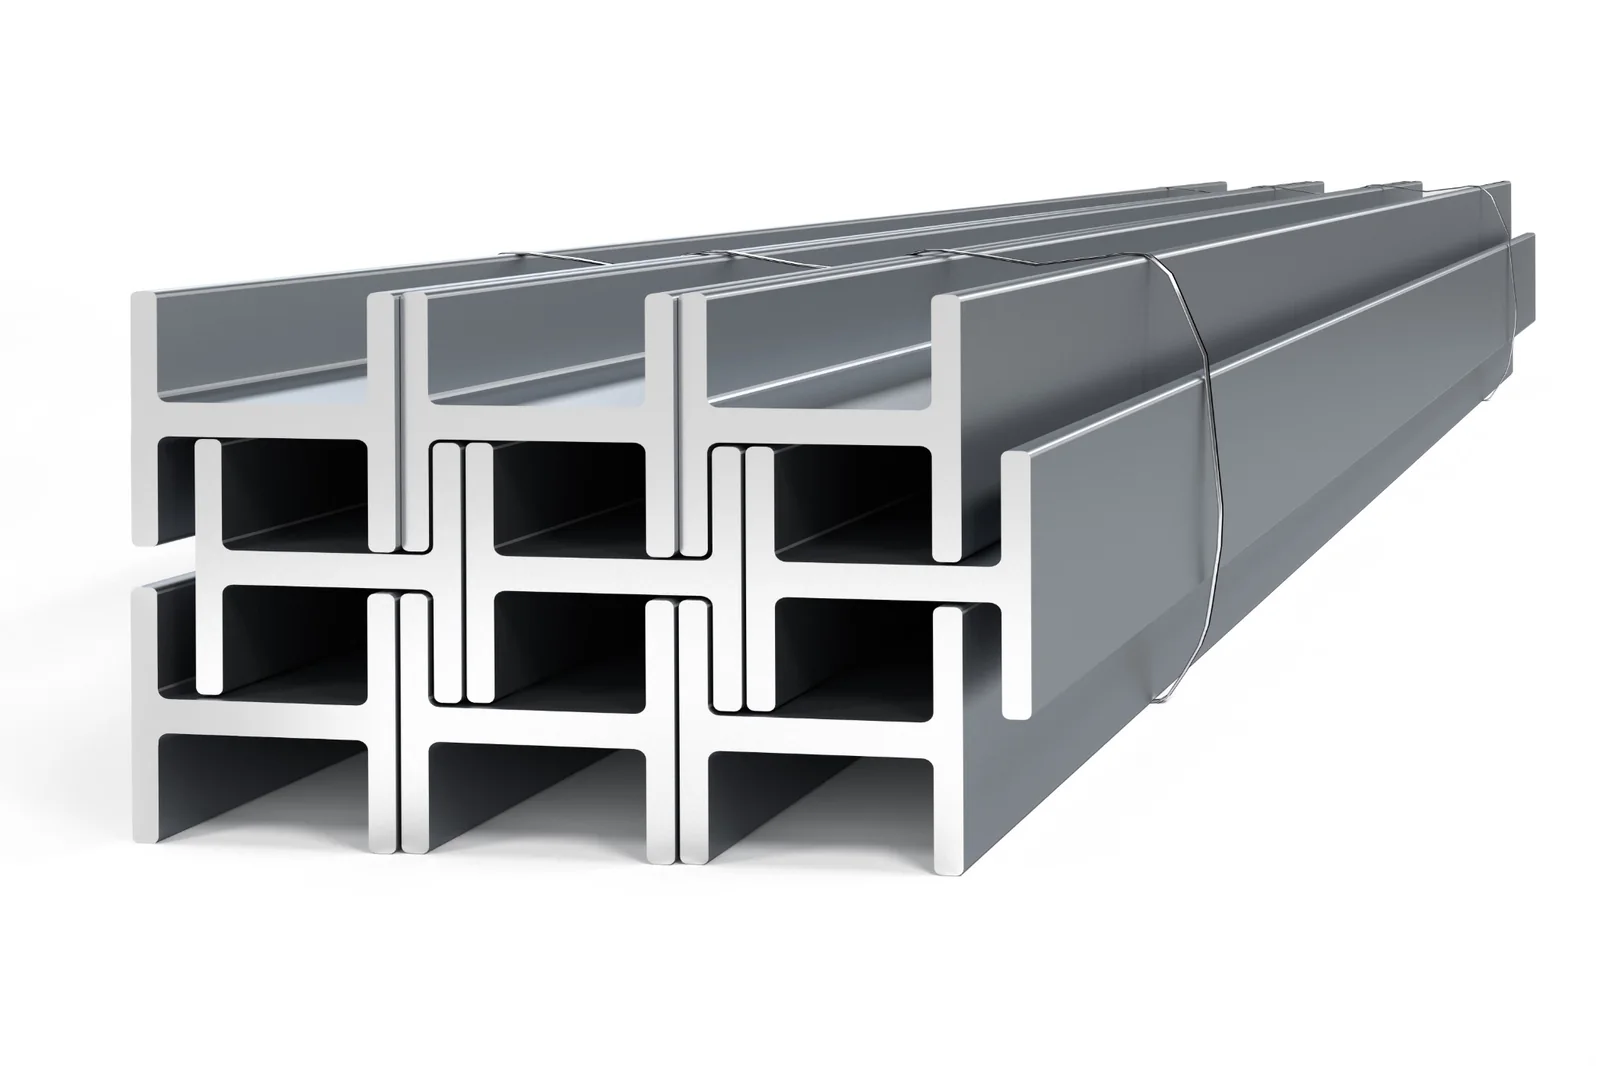
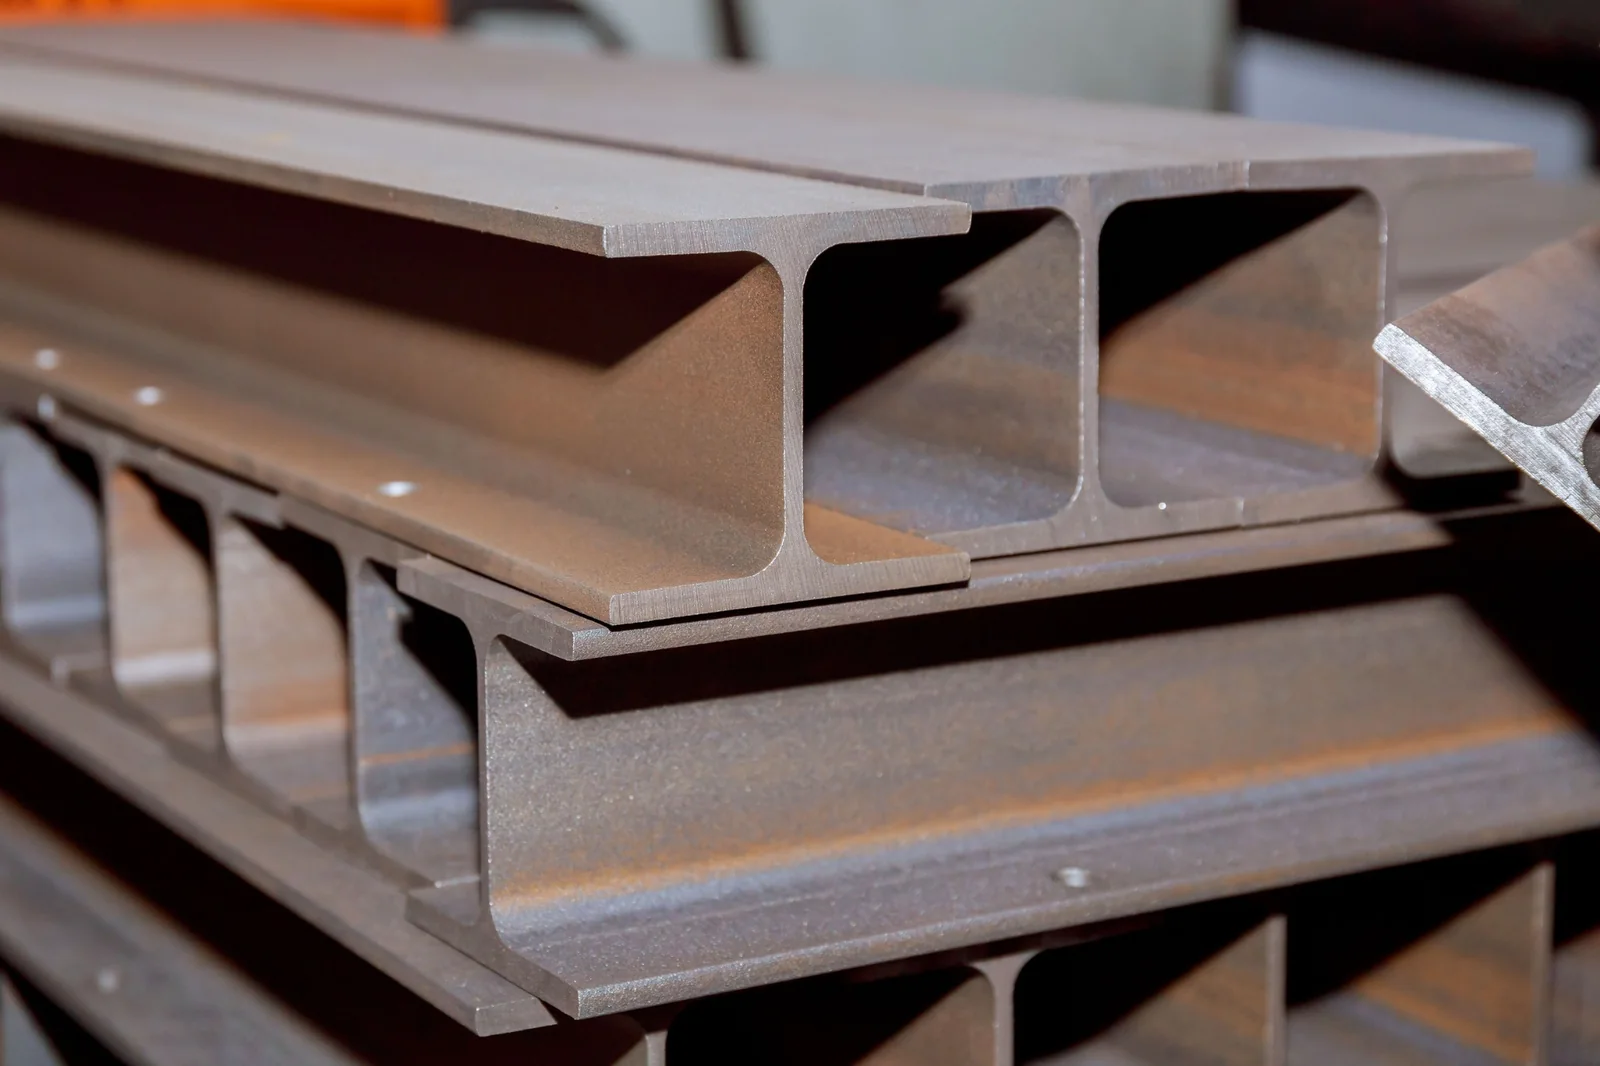
Count unbundled structural steel stacks by recognising exposed H-shaped profile ends instead of depending on missing tags.
Support routine cycle counts, physical inventory campaigns, low-stock validation and future trailer verification workflows.
Use a quality gate plus review logic to manage yard variability, partial obstruction and inconsistent profile visibility.
Operators capture exposed beam ends using a guided mobile workflow, or the platform ingests suitable CCTV / fixed yard camera images.
Each session is tied to facility, zone, storage location, stack, column and profile so every count is operationally traceable.
The AI checks image quality, identifies H-shaped visible ends, separates touching instances and generates a piece count with confidence.
Low-confidence detections caused by rust, shadows or partial obstruction are surfaced for quick review rather than forcing manual counting every time.
Verified counts are preserved with evidence and compared against system quantity, thresholds and bill of lading expectations.
Dashboards summarise count completion, variance trend, low-stock risk, exception workload and campaign activity for faster decisions.
Capture steel stacks from a phone or use available camera feeds where the exposed profile ends are visible.
Attach facility, zone, location, stack, column and profile data to the capture session.
Run a profile-aware vision model to find each visible H-shaped wide flange end and convert detections into counts.
Route only uncertain detections for review so the workflow remains quick but controlled.
Compare the verified count against expected quantity, system stock and future BOL quantities before final posting.
Surface exceptions, low stock, campaign progress and location-level variance in a beautiful operational dashboard.
Useful when mill tags are lost during movement and put-away.
Built around conditions like rust, shadows and inconsistent stacking.
Supports frequent counts without needing full manual piece-by-piece checks.
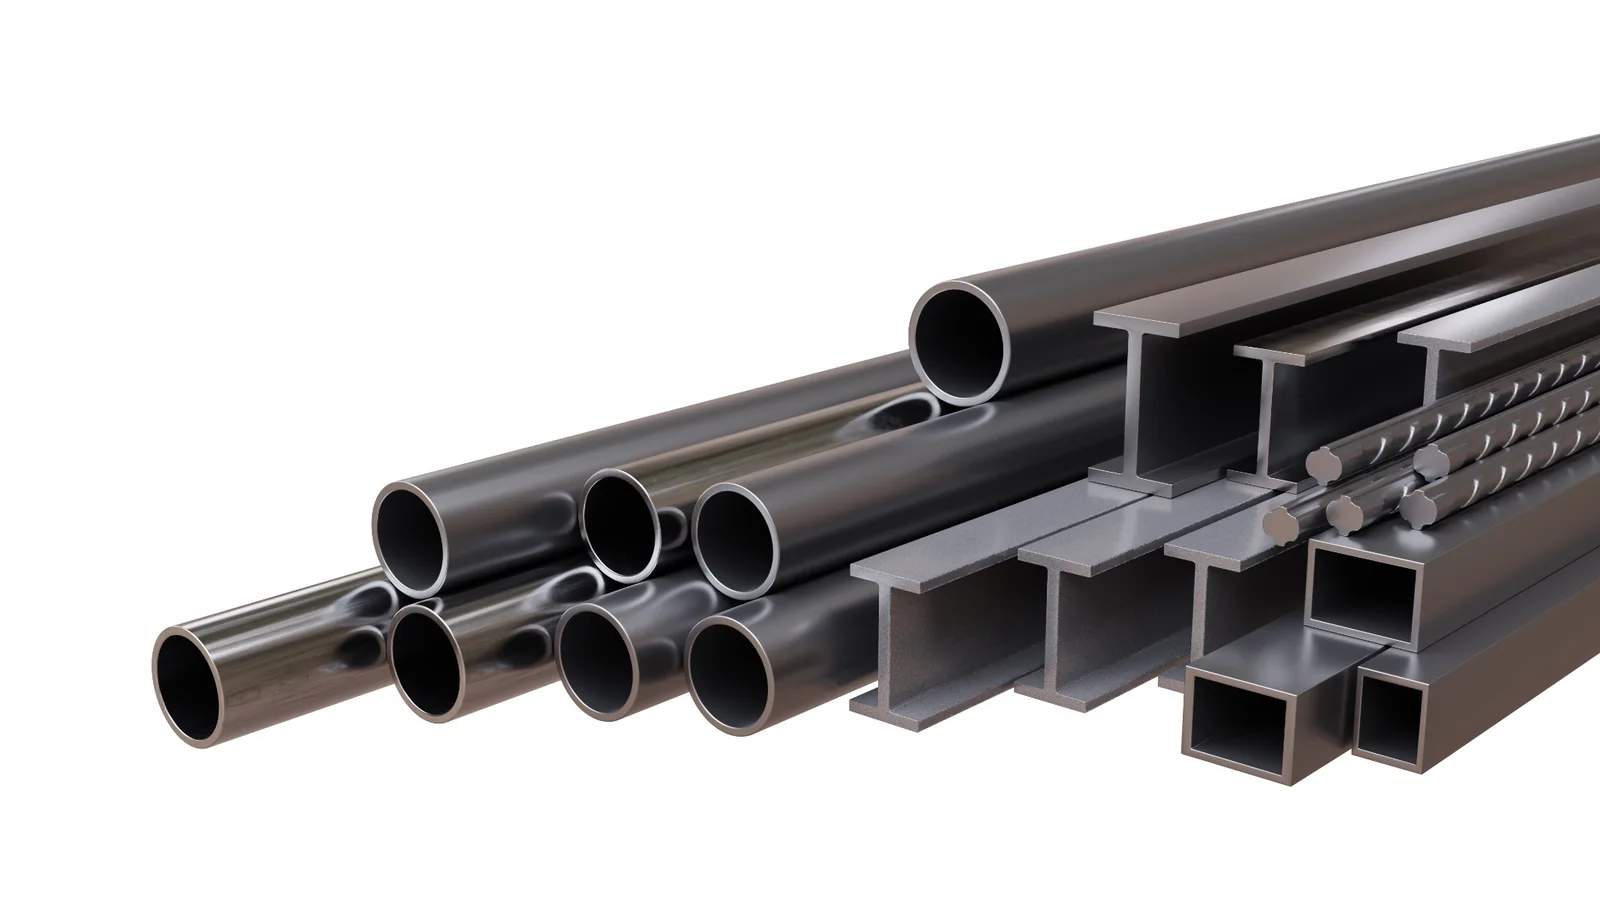
Future path to tube, pipe, angle, channel and loaded-trailer checks.
Move into the interactive application and click through the full count journey step by step.
Convert mobile, CCTV and yard-camera images into location-level piece counts, exception queues and inventory insights — designed for outdoor stacks of wide flange beams and future structural profiles.
W14×90 at Zone D is 11 pieces below its configured threshold.
8 W12×65 pieces visually detected in Stack C-07 but not assigned in the inventory record.
46 storage locations completed with 4 remaining before the daily cut-off.
Counts visible steel profiles using geometry and appearance rather than relying on labels.
Handles changing light, shadows, rust, uneven stacks and partial obstruction through quality checks and exception review.
Organises results by facility, zone, storage location, stack, column and material profile.
Extensible from wide flange beams to tube, pipe, angle, channel and loaded-trailer verification.
Complete each stage to simulate an end-to-end count from image capture to inventory posting.
The workflow adapts the validation and approval steps based on the operational purpose.
Use a guided mobile capture for immediate deployment, or connect fixed cameras as the solution scales.
Location context improves traceability and helps select the correct vision model and tolerance rules.
The new visual count will be compared against the system quantity and the previous verified result.
Select a sample supplied for this demonstration, or upload a local image to simulate a new count.
The demo simulates image quality checks, profile detection, segmentation, de-duplication and confidence scoring.
Low-confidence detections are surfaced for human validation before the inventory record is updated.

One partially obstructed profile and one heavy-rust profile were retained with lower confidence.
Inspect detections, resolve exceptions and preserve a complete count audit trail.
Mobile Guided Capture · Zone D / D-14 / Stack 03
Today, 10:42:18 AM7 pieces detected · 97.9% mean confidence
Today, 10:42:26 AM2 lower-confidence detections placed in exception queue
Today, 10:43:02 AMAwaiting review approval and reconciliation disposition
PendingOnce the Warehouse Manager completes validation, the report moves to the Audit Manager with image evidence, AI detections, quantity comparison and a complete activity log.
Submitted and awaiting independent review
Final audit completed
Action required by warehouse team
Illustrative turnaround time
Every Warehouse Manager submission arrives with the original image, AI detections, manual adjustments, confidence information, location context and activity history.

Audit decisions remain separate from the Warehouse Manager submission, preserving role-based accountability.
Prioritise by variance, confidence, location and submission age. Open any report to inspect the full evidence package.
Open a submitted reportReview image, detections and warehouse actions.
Complete audit checksConfirm evidence and quantity logic.
Record final decisionApprove, return or request recount.
Validate the submitted quantity using the original capture, detection evidence, metadata and warehouse activity history.

The final approval posts the record into the approved inventory history. A recount or return decision sends the report back to the Warehouse Manager with your note.
Approved reports retain the original image, submitted count, decision note, user actions and timestamps for traceability.
Translate count activity into faster decisions on inventory risk, variance, location health and count productivity.
Zone D is the main variance driver, contributing 38% of all count discrepancies in the selected period.
W14×90 inventory requires immediate validation because the visual quantity is below the configured threshold.
Count productivity is improving, with the average count session 25% faster than the first week of the period.
Plan count waves, monitor completion by location, route exceptions and maintain sign-off evidence in one workflow.
Locations remaining74
Open exceptions31
Active count teams8
Estimated completion1.6 days
117 locations completed today14% above the planned daily rate
D-14 / Stack 03 verified at 42 piecesMobile capture · W14×90 · 2 minutes ago
−1 varianceC-07 / Stack 01 sent for location review8 visual pieces not assigned in system record · 6 minutes ago
ExceptionTeam 3 started Zone E count waveMixed structural profile workflow · 11 minutes ago
In progressZone B sign-off posted to campaign record76 locations · 4,920 pieces · 24 minutes ago
CompleteCompare visible loaded quantities against bill of lading line items before the trailer leaves the facility.

W12×65 line item is one piece below the bill of lading quantity. Verify the load or update the document before release.
Begin with exposed ends of wide flange beams, then extend the same workflow to additional profile families through phased model training and validation.

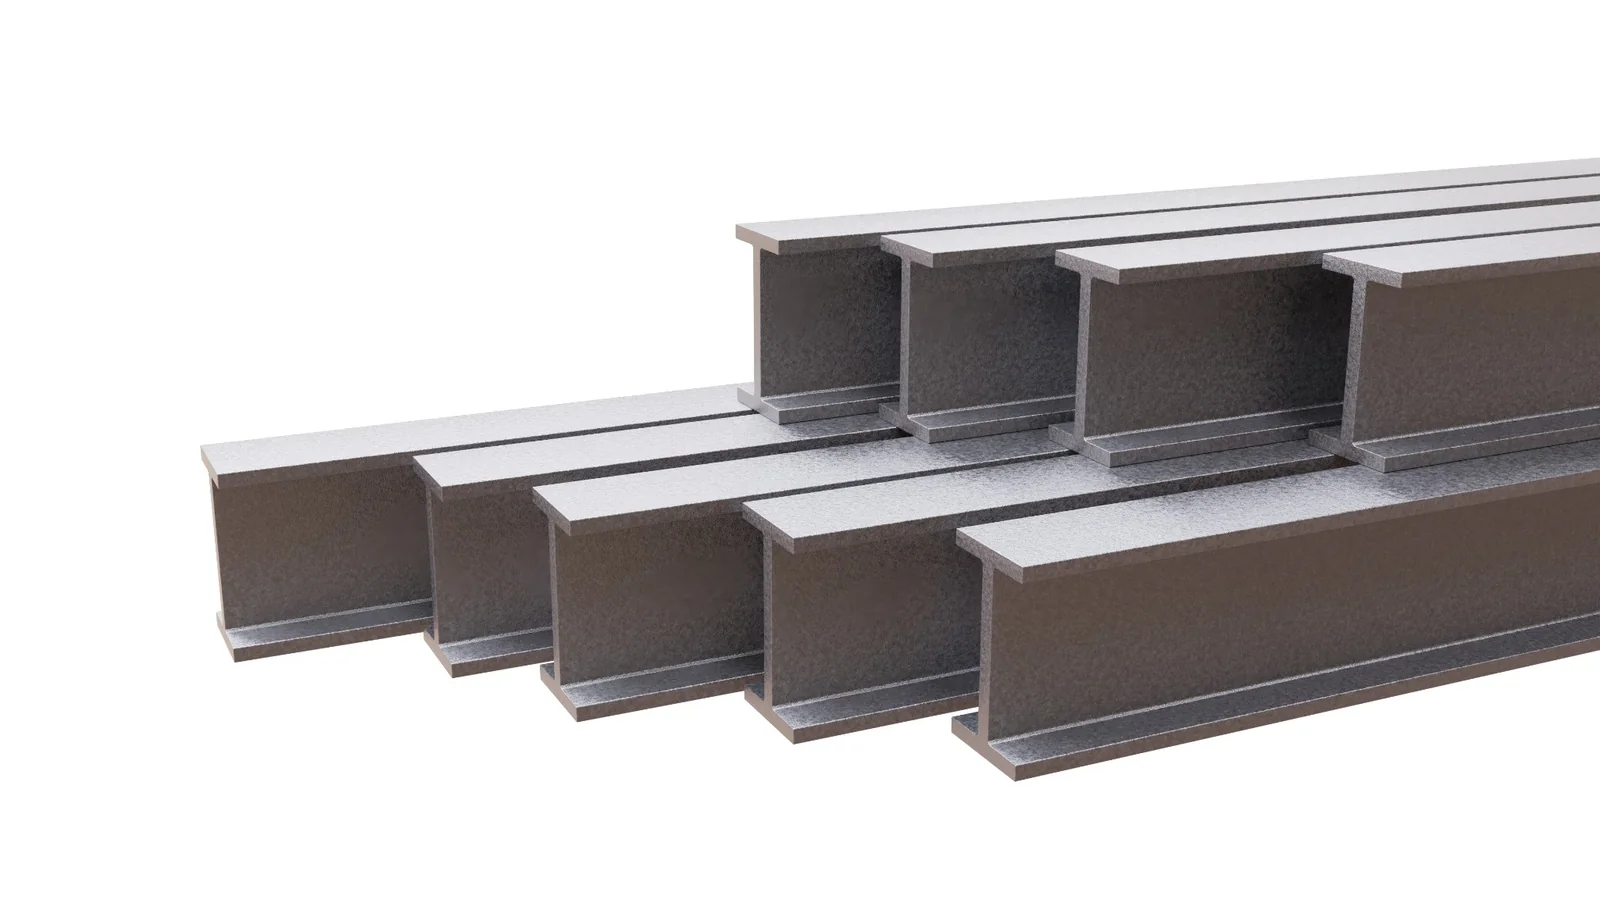
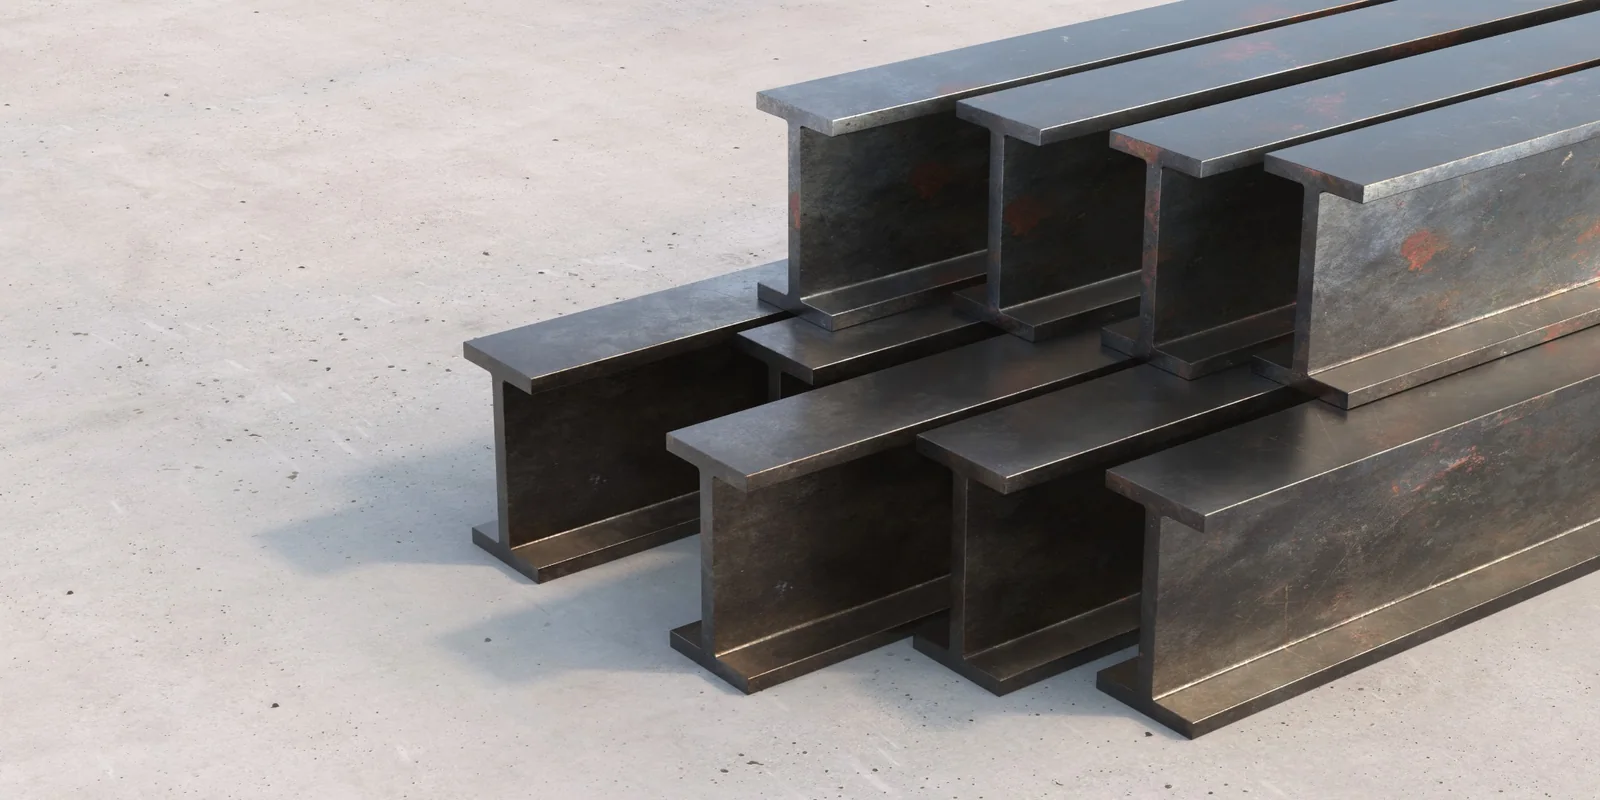
Initial use caseExposed H-shaped ends, stacked on their sides in columns.
ExpansionCount visible profile ends and associate bundle-level metadata where available.
ExpansionDetect open-channel and angle geometries under varied orientation.
ExpansionSupport circular, square and rectangular cross-sections alongside beams.
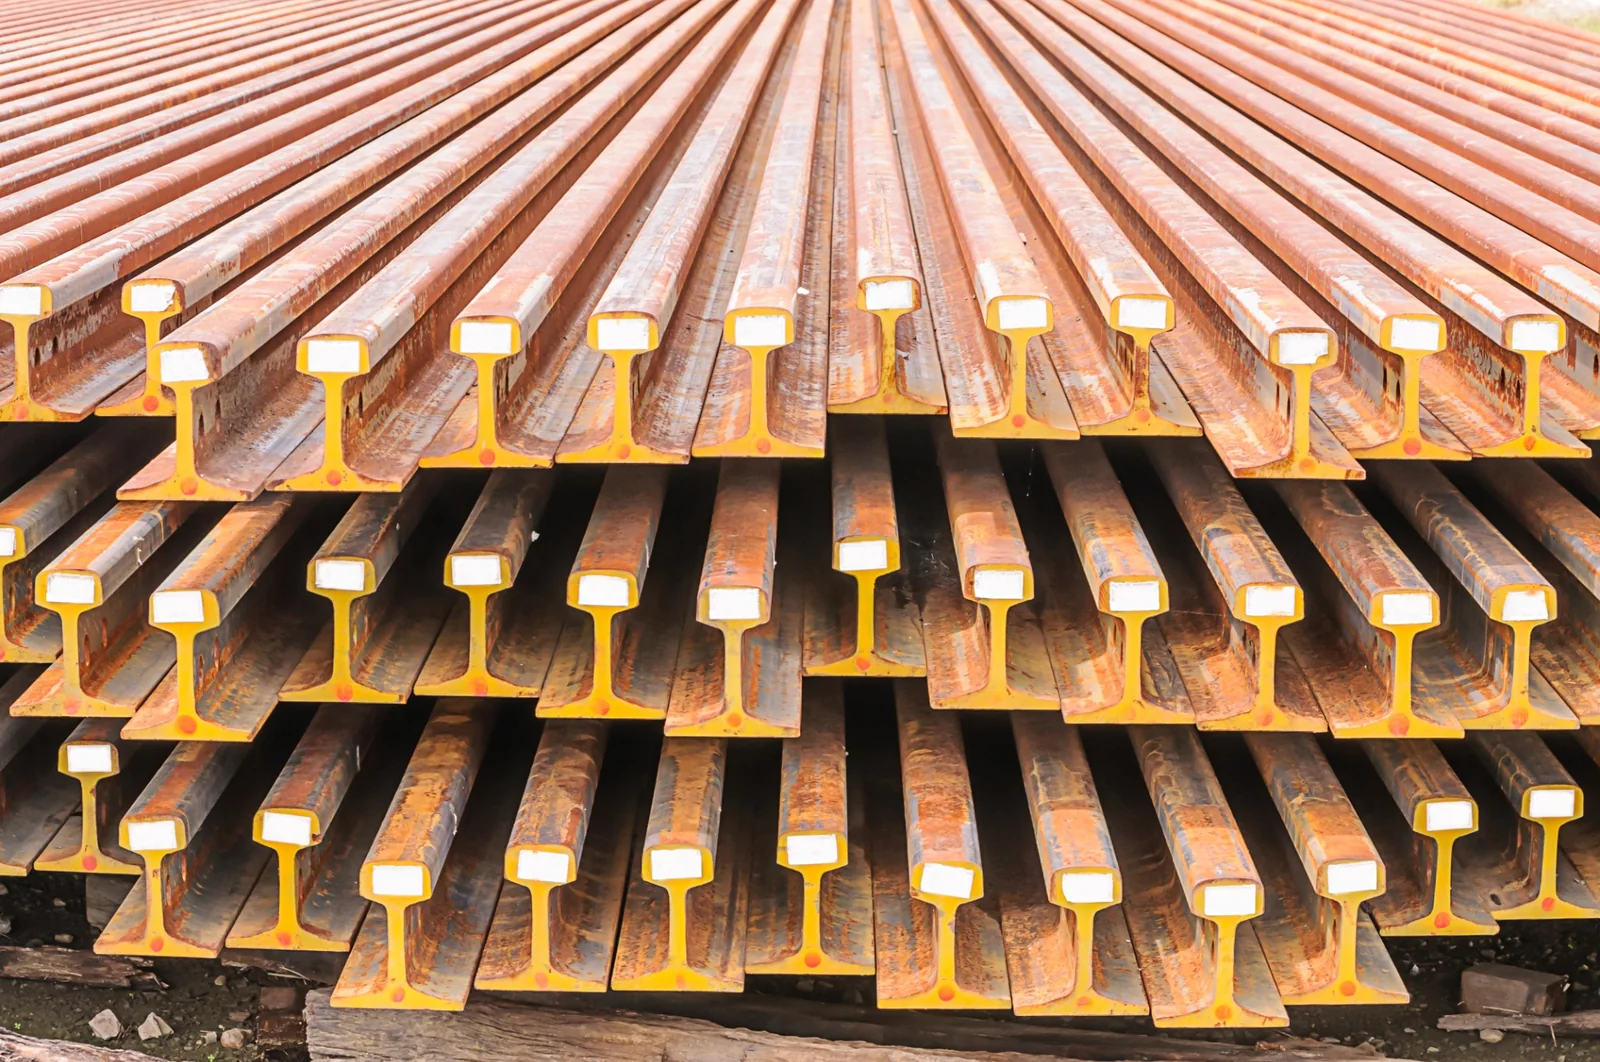
ExploreEvaluate rail and other repeatable cross-sections as dedicated model classes.
RobustnessIncrease robustness across camera position, depth and partially visible ends.
A modular architecture that can begin with guided mobile capture and expand to fixed cameras, enterprise integrations and multi-location operations.
Operators can use a guided web application on a phone or tablet to capture visible profile ends. The same ingestion layer can later accept still images or streams from suitable CCTV and fixed yard cameras.
Vision inference runs close to yard cameras while sensitive images and operational records remain within the organisation's environment.
Perform image inference at the edge and synchronise approved count results, dashboards and integrations through central services.
Centralise model hosting, storage, workflow and analytics in an approved cloud environment with secure camera or mobile ingestion.
A phased pilot establishes the operational baseline, validates the wide flange use case under real yard conditions and defines a production rollout plan.
Confirm locations, stack patterns, count process, camera options, inventory records and pilot success measures.
Capture representative images across lighting, rust, stack density, perspective and obstruction conditions.
Deploy the guided count workflow, review queue, dashboard and pilot integrations for controlled operational testing.
Measure performance by condition, close pilot gaps and define production architecture, rollout and model expansion.
Measured by profile, stack density, camera angle and yard condition against verified ground truth.
Performance across shadows, rust, uneven stacking, partial obstruction and changing light.
Time from capture through review and posting compared with the current process.
Percentage of images and objects requiring recapture or human confirmation.
Ability to identify meaningful quantity and location mismatches for action.
Decision point after pilot
Proceed to production only after agreed performance and operational measures are met on representative yard data.